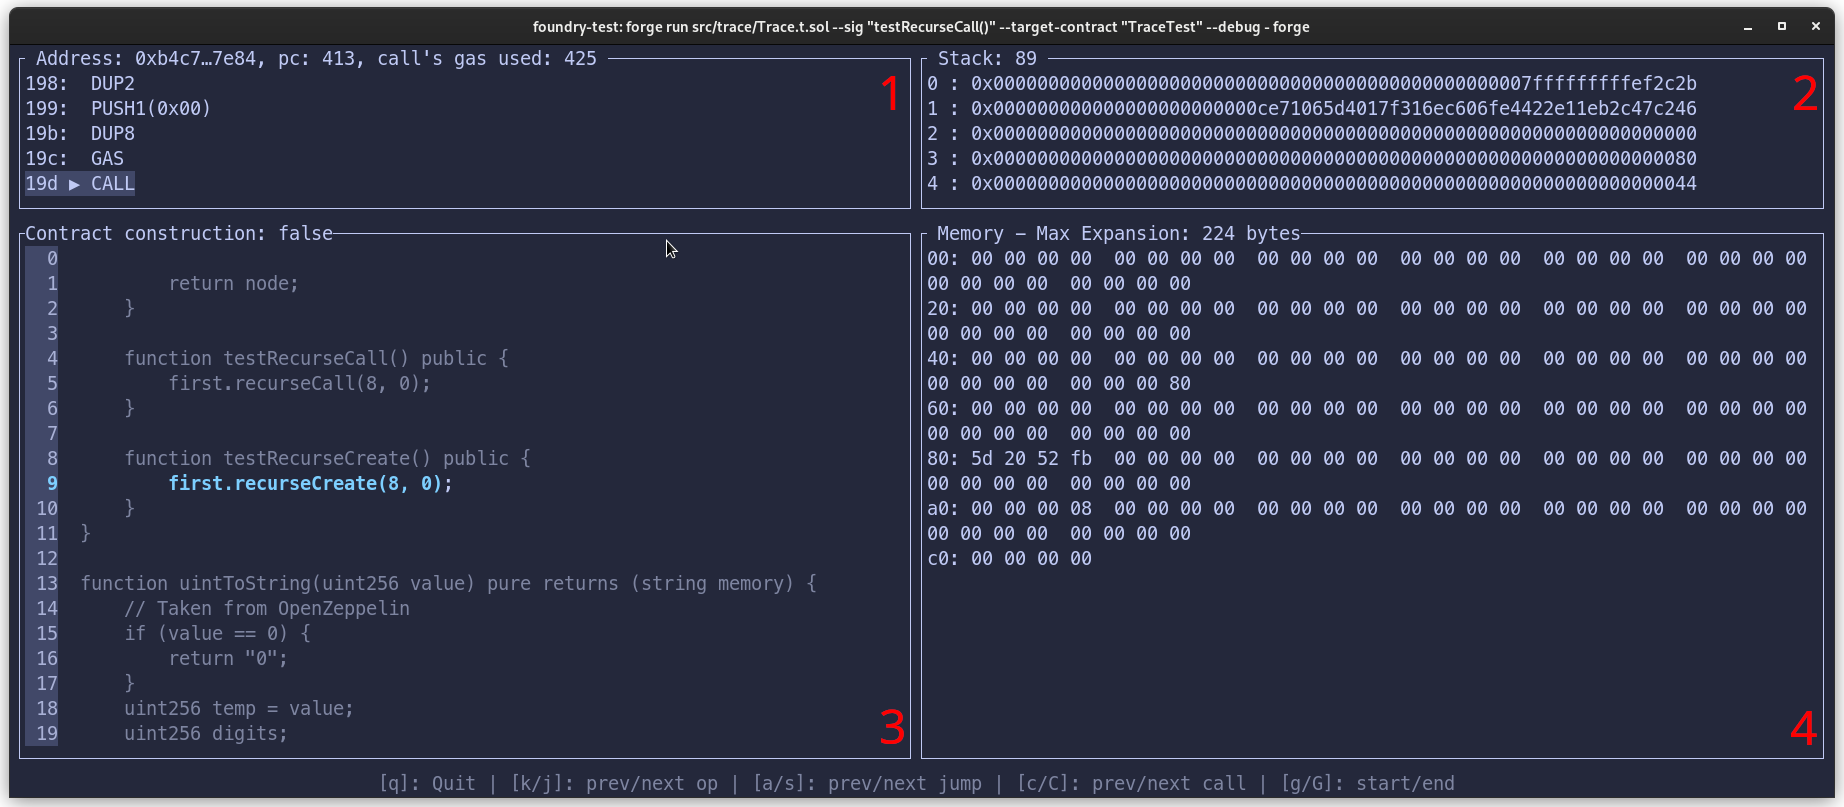
Debugger
Forge ships with an interactive debugger.
The debugger is accessible on forge debug and on forge test.
Using forge test:
$ forge test --debug $FUNC
Where $FUNC is the signature of the function you want to debug. For example:
$ forge test --debug "testSomething()"
If you have multiple contracts with the same function name, you need to limit the matching functions down to only one case using --match-path and --match-contract.
If the matching test is a fuzz test, the debugger will open the first failing fuzz scenario, or the last successful one, whichever comes first.
Using forge debug:
$ forge debug --debug $FILE --sig $FUNC
Where $FILE is the path to the contract you want to debug, and $FUNC is the signature of the function you want to debug. For example:
$ forge debug --debug src/SomeContract.sol --sig "myFunc(uint256,string)" 123 "hello"
You can also specify raw calldata using --sig instead of a function signature.
If your source file contains more than one contract, specify the contract you want to debug using the --target-contract flag.
Debugger layout

When the debugger is run, you are presented with a terminal divided into four quadrants:
- Quadrant 1: The opcodes in the debugging session, with the current opcode highlighted. Additionally, the address of the current account, the program counter and the accumulated gas usage is also displayed
- Quadrant 2: The current stack, as well as the size of the stack
- Quadrant 3: The source view
- Quadrant 4: The current memory of the EVM
As you step through your code, you will notice that the words in the stack and memory sometimes change color.
For the memory:
- Red words are about to be written to by the current opcode
- Green words were written to by the previous opcode
- Cyan words are being read by the current opcode
For the stack, cyan words are either being read or popped by the current opcode.
⚠️ Note
In most test frameworks, the first test assertion to fail is the one reported. In foundry, the last test assertion to fail (that comes from DSTest or cheatcodes) is the one to be reported.
Navigating
General
- q: Quit the debugger
- h: Show help
Navigating calls
- 0-9 + k: Step a number of times backwards (alternatively scroll up with your mouse)
- 0-9 + j: Step a number of times forwards (alternatively scroll down with your mouse)
- g: Move to the beginning of the transaction
- G: Move to the end of the transaction
- c: Move to the previous call-type instruction (i.e.
CALL,STATICCALL,DELEGATECALL, andCALLCODE). - C: Move to the next call-type instruction
- a: Move to the previous
JUMPorJUMPIinstruction - s: Move to the next
JUMPDESTinstruction - ’ + a-z: Move to
<char>breakpoint set by avm.breakpointcheatcode
Navigating memory
- Ctrl + j: Scroll the memory view down
- Ctrl + k: Scroll the memory view up
- m: Show memory as UTF8
Navigating the stack
- J: Scroll the stack view down
- K: Scroll the stack view up
- t: Show labels on the stack to see what items the current op will consume